#30DayChartChallenge Día 10: ¡Buceando en la Distribución del VIX! 
En lugar de solo ver la línea del VIX, hoy analizamos su "distribución de probabilidad" por Presidencia de EE.UU. (Clinton -> Trump 2º). ¡La forma lo es todo!
Usando #rstats y #ggplot2, estas densidades facetadas nos permiten investigar:
* Modos Dominantes: ¿Cuál era el nivel "normal" de VIX (el pico más alto)? ¿Cambió mucho?
* Multi-modalidad: ¿Hay evidencia de múltiples estados de volatilidad (picos secundarios) dentro de un mismo mandato? 
* Riesgo de Cola: ¿Qué tan probable era el "pánico" (VIX > 35)? ¡Compara las colas derechas!
Estos patrones reflejan los distintos regímenes de volatilidad y la percepción del riesgo sistémico. No es solo el nivel, ¡sino la "estructura" de la incertidumbre lo que importa!
Datos: Yahoo Finance via #quantmod.
 Código: https://t.ly/kikdo


 https://tidytues.day/2025/2025-04-15
 https://zenodo.org/records/14902740
 overlaying a black paint splash.")

 and bill length (y-axis, in mm) for three penguin species at Palmer Station LTER. Adelie penguins are represented by orange circles with a slight positive trend line. Chinstrap penguins are shown with purple triangles, clustering higher on the bill length axis and a steeper trend line. Gentoo penguins are shown with dark green squares, positioned farther right along the flipper length axis, with their own upward trend line. A legend at the bottom right indicates the color and shape used for each species. The image is from the palmerpenguins R package.")


 **Major foreign holders of US Treasury Securities (2022)**

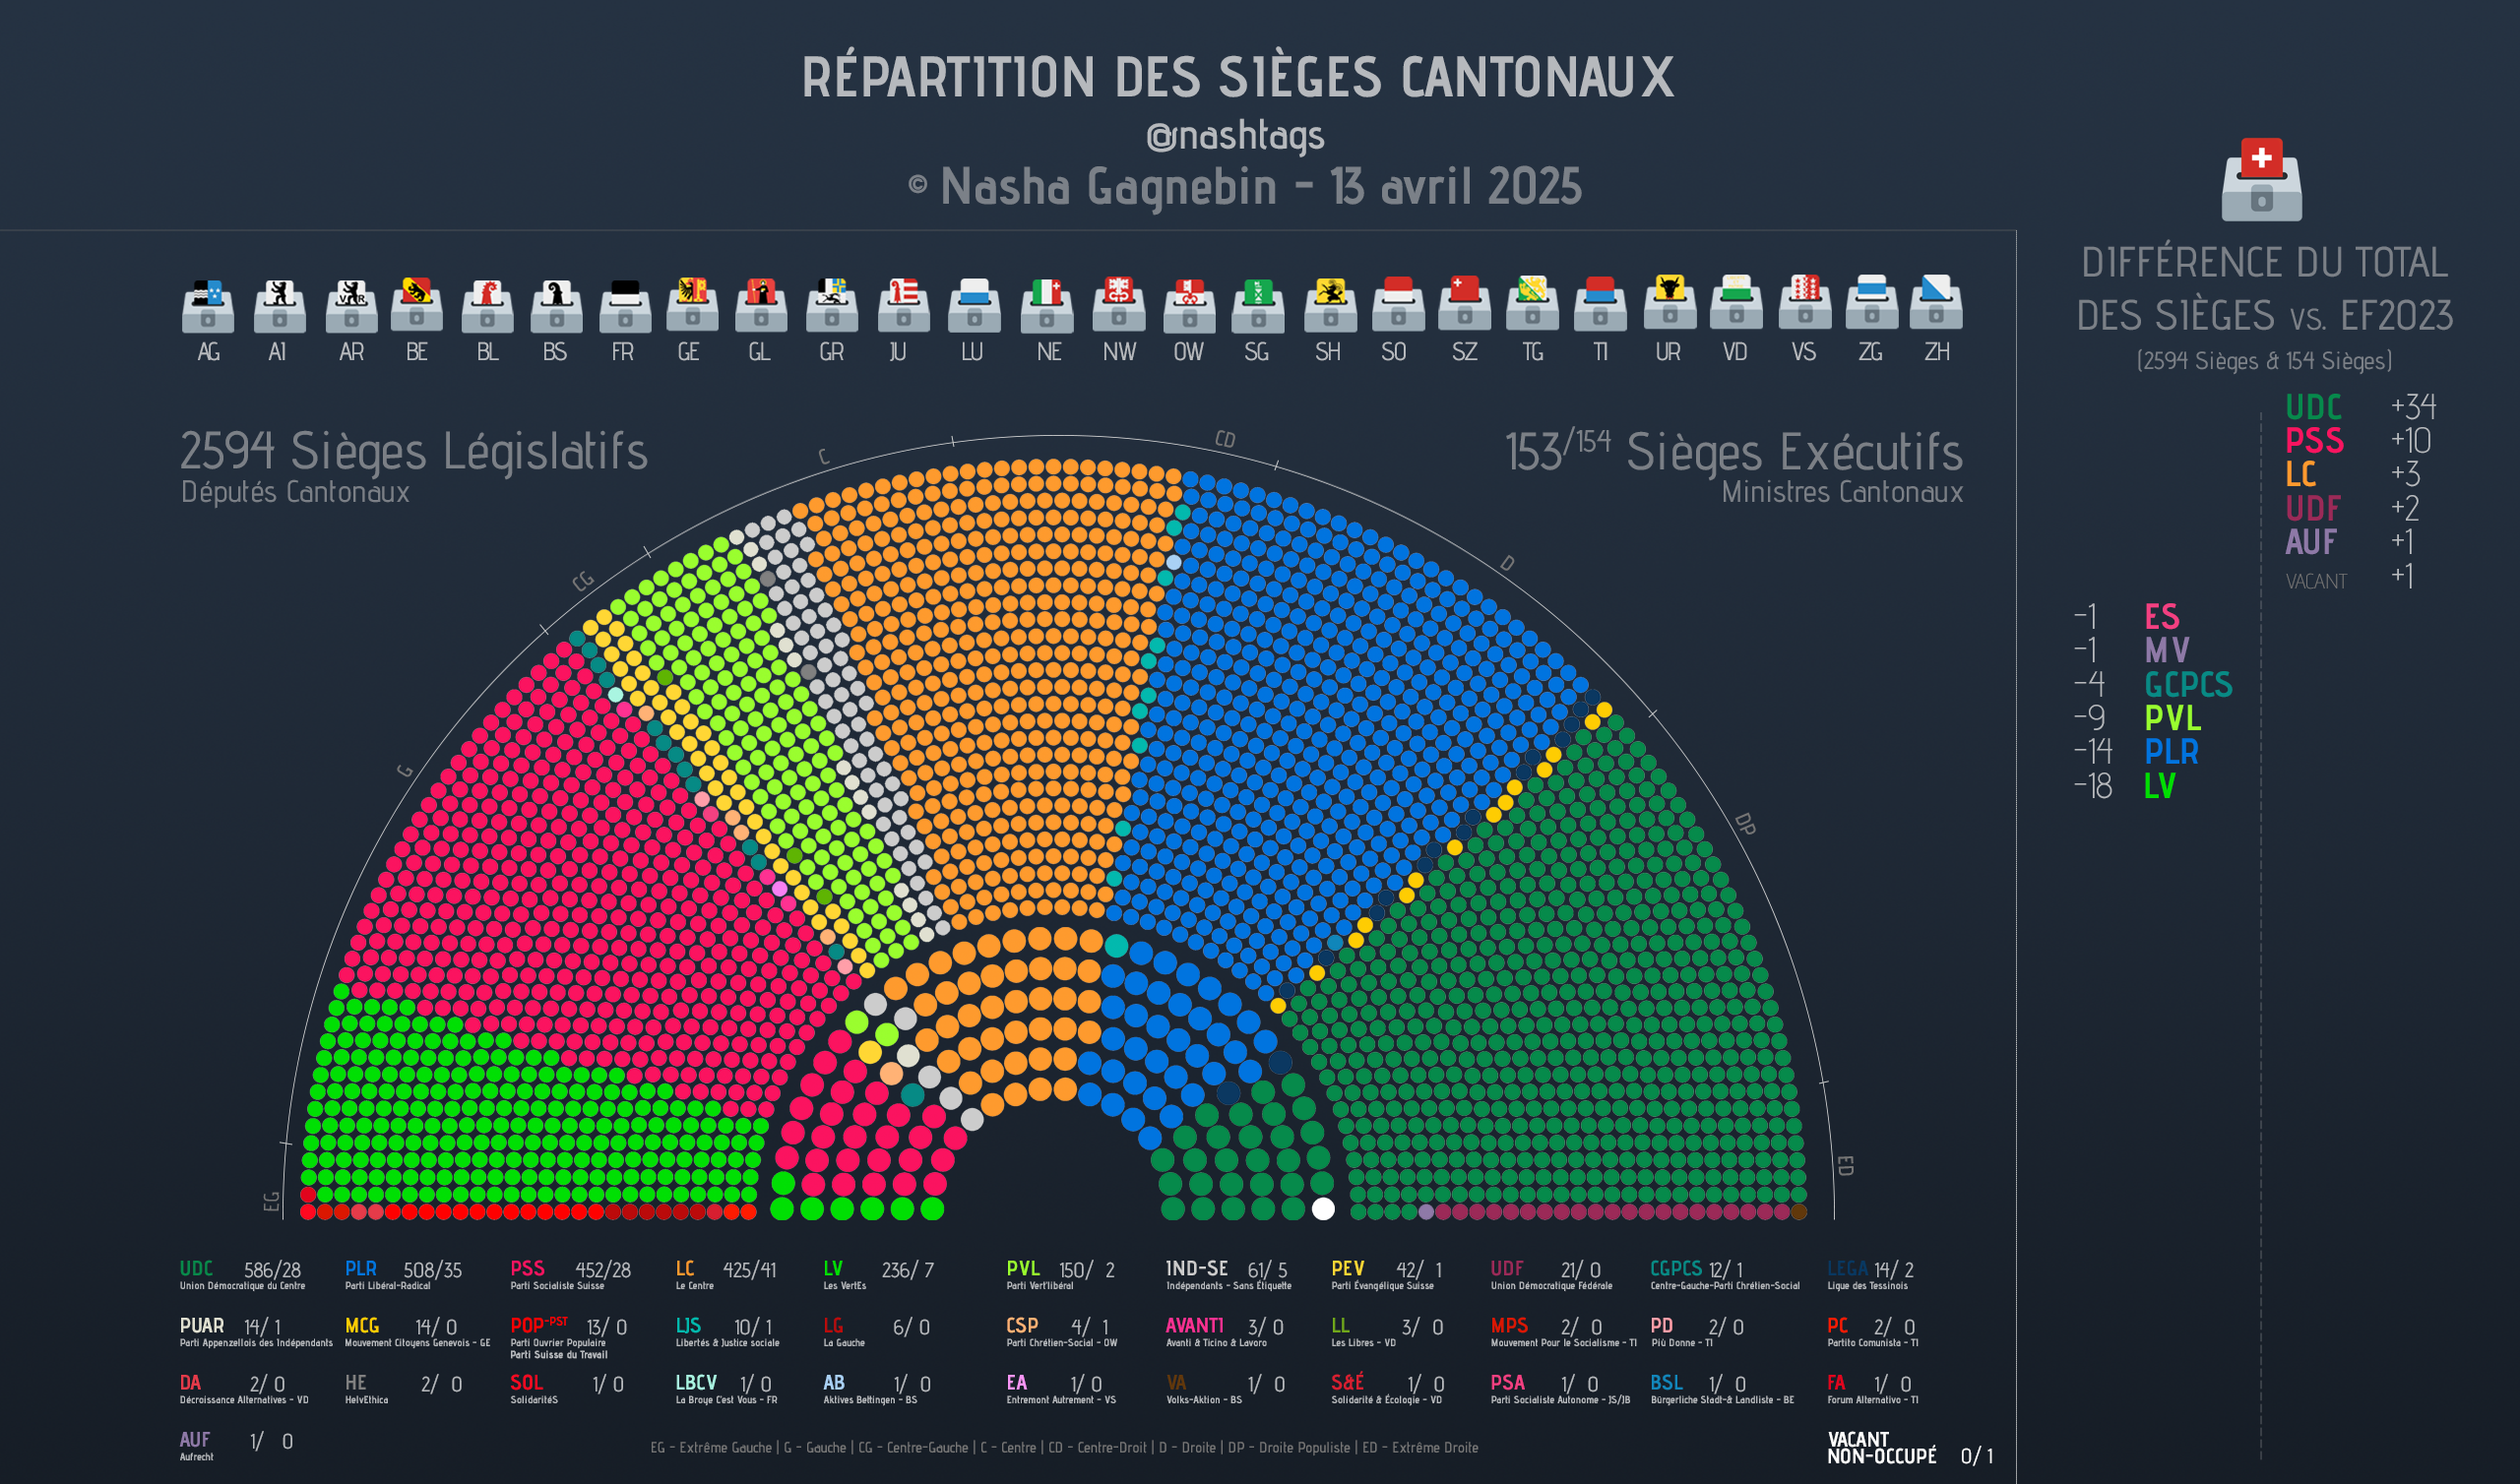
 Noms 2594 DéputéEs:


 Explorando la relación Masa Corporal vs Longevidad Máxima.
  , este scatter plot log-log revela patrones.
 Carnívoro(verde)
  Herbívoro(ocre)
  Omnívoro(azul).
 y la Masa Corporal (kg, eje X) para aproximadamente 170 especies animales. Los puntos están coloreados según la dieta: verde para Carnívoro, naranja/ocre para Herbívoro y azul apagado para Omnívoro. Se observa una tendencia general positiva. Los puntos de diferentes dietas muestran cierta agrupación y solapamiento. El gráfico utiliza un tema con fondo beige claro y textos en marrón. Título: \"Relación Masa Corporal vs. Longevidad en Animales\". Fuente: Kaggle dataset by Sourav Banerjee.")


Who's coming with you? (Audience: execs, public, analysts?)
How often will this trip happen? (Once? Daily?)
What do you need to bring? (Data sources, interactivity, servers, customization)
Are you on an exploratory (self-serve) or explanatory (guided) route?")

’ and ‘Butt(s)’ are mentioned in Bob’s Burgers episodes. Farts are mentioned a total of 309 times and peak in Season 4 Episode 12 (31x). Butts are mentioned a total of 553 times and peak in Season 11 Episode 2 (27x)")


 2025
2025  :
:  of Annual Average Daily Traffic across ten California counties. The x-axis shows traffic volume from 100 to over 100,000 vehicles on a logarithmic scale. Horizontal dashed lines mark the 25th, 50th, and 75th percentiles. Urban counties like Los Angeles (LA) and Orange (ORA) show curves shifted right, indicating higher traffic volumes. In contrast, rural counties like Tulare (TUL) show curves shifted left, indicating lower traffic volumes.")
 Explorando la distribución del spread 10Y-2Y del Tesoro USA (datos de FRED desde 1976).
 Es la famosa señal pre-recesión. La distribución nos dice cuán "normal" es esa señal en perspectiva histórica.
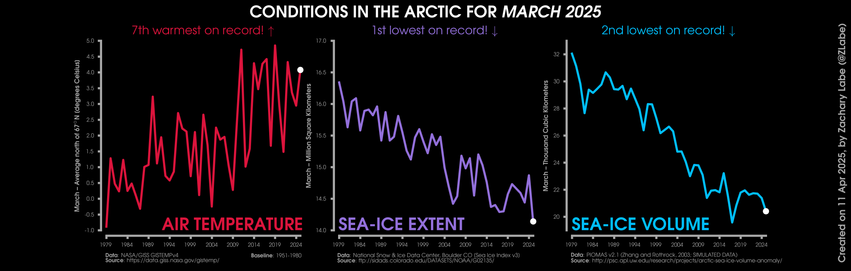

 Data from the Met Office on average temperatures
 Designed with {ggplot2} in
  Crocheted with yarn

 Showing % of world income received by richest 1% from 1980-2023 (
 Inspired by the iconic climate change warming stripes chart
 Made with Plotnine in Python

 Still working on some styling and how easy it is to select a point
 Will probably end up as a blog post soon!
 and storing those in qs files, as well as rendering pre-generated Mapbox vector tiles.
, Joe Biden y Donald Trump (2º mandato, inicio). Cada faceta corresponde a un presidente. El eje X representa el nivel del VIX y el eje Y la densidad. Las curvas de densidad están coloreadas según el partido: azul para Demócrata, rojo para Republicano. Una línea vertical discontinua marca VIX=20 y una línea vertical punteada marca VIX=35. Fuente: Yahoo Finance.")